

The Definitive Guide to Conceptualizing, Designing and Promoting Your Own Infographic
This YouMoz entry was submitted by one of our community members. The author’s views are entirely their own (excluding an unlikely case of hypnosis) and may not reflect the views of Moz.
Infographics became immensely popular in 2009 and Internet marketers rode the waves of the popularity of this medium to grab countless eyeballs and links. For the early adopters, infographics proved to be a gold mind, but magic of this medium faded as soon as the gold rush began.
Thousands of online marketers jumped in hastily to benefit from the sudden upsurge in demand for infographics. Shoddy infographics with unverified (or even made up) facts and too many embedded anchor texts became the order of the day. Even Matt Cutts expressed his displeasure at the way online marketers were exploiting infographics and warned that in future infographic links may get discounted.
This makes it challenging, in the current scenario, to build infographics that provide a satisfactory ROI. But, creating and promoting a relevant infographic that interests the target audience can help you make this medium work for you. Short retention spans of readers and the ease with which visuals can convey complex ideas or huge chunks of information ensures that well-thought out and attractively designed infographics never go out of fashion.
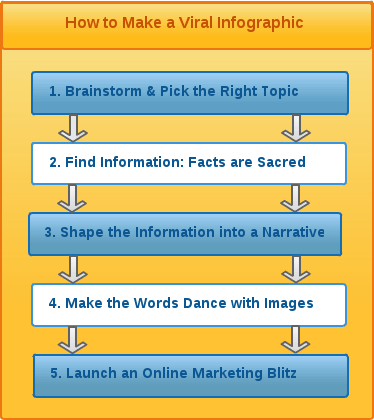
In this post, we will show how you can conceptualize, design and promote a successful infographic on your own. Read ahead to learn how to find the right concept for the infographic, how to write compelling content (and where to find legitimate data), how to create attention-grabbing designs (and what free resources you can use to do that), and how to promote your infographic (and hopefully make it go viral).
1. Ideation and Topic Selection
If you have ever designed an infographic, you know how critical it is to pick the perfect topic. You need to find a topic that will appeal to your target audience that is relevant to the industry, that suits the infographic medium and that has enough publicly-available data to create an effective infographic. Smart brainstorming with your team mates will yield a list of potential topics.
Pass the topics you have shortlisted through the sieve of the following questions:
- Will the target audience be interested in the subject?
- Does the choice of the subject reflect well upon my brand?
- Is it original enough? If not, can I present it in a novel way? (Google TOPIC NAME+infographics to check originality)
- Is there enough complexity in the topic to warrant a visual representation?
- Is the topic too big for a single infographic?
- Is the topic trending and popular currently? (Use Google Analytics and Google Insight and Trends to find out)
- Do we have enough interesting information about it?
- Do we have access to data sources out there that can provide information?
Once you have selected the topic, it is time to start researching the topic and gathering data.
2. Information Gathering
If you are working for a client and already have information and ideas from the client, you are fortunate. But if you are conceptualizing and putting together an infographic all on your own, you will have to crawl the web to find relevant data. A well-designed infographic cannot succeed unless it also provides usable and eye-grabbing information. No matter what type of infographic you are planning to create, facts and statistics will be the driving force behind it.
So how do you find relevant data for free? Here is a list of credible, free (some only allow trials) sites to start you off.
- Forrester
- Market Research
- Gartner
- Internet2Go
- Yankee Group
- Nielsen
- Frost & Suillivan
- World Bank Data
- UN Data
- UN Statistical Yearbook
- UN Demographic Yearbook
- Google Public Data
- Guardian Data
- Guardian World Government Data
- US Government Business Data
- Federal Statistics
- UNESCO Data Centre
- EuroStat
- List of International Statistical Agencies
There is a wealth of facts and stats on these sites and most of it is freely available. Needless to say, there are several other places where you can get pertinent information for your infographic.
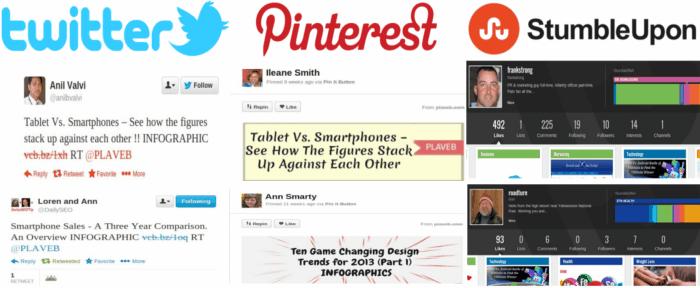
Infographics that serve the single purpose of presenting statistics in an easily understandable form tend to do quite well. For instance, we slapped up a quick infographic comparing quarterly smartphone sales over three years.
We were sure that it would be worthwhile to spend a little time on the project, as the information we intended to provide was not available in just one place. The infographic yielded a lot of links and we hit the jackpot when we were featured in an Econsultancy's list of top six infographics that week. As an added bonus, we got a lot of social media mileage when famous people liked us and tweeted about our infographic, and also shared it on StumbleUpon and Pinterest.
If you don't want to put too much effort into it, but want to get limited success through a simple infographic, finding an untouched topic and creating a stats-based graphical representation can work for you. Such data-driven infographics are ideal when you are planning to:
- Compare a set of values
- Explore rise and fall of something over time
- Break a whole in different individual parts
- Point out relation between different sets of data
But if you are planning to create an outstanding infographic, you will have to work harder and find the right narrative.
3. Writing the Words, Telling a Story
So, you know what the topic is and you have collected all the information related to the subject. Perhaps you have also designed Venn diagrams, pie charts, graphs and maps. Now, it is time to think deeply and decide upon the angle from which you will present the information.
A high-end infographic is more than a collection of visually appealing facts: it is a presentation of a point of view. So, put on your thinking hat and transform the facts into a compelling story. The structure of your narrative will determine the flow of facts.
Sift through the data and try to find connections and stories that are not apparent. Build a clear hierarchy, find a central idea and use the other ideas to bolster your key concept. And yes, don't forget to come up with a memorable, intriguing TITLE!
Come up with an original, fresh and entertaining way of looking at the situation, and you will multiply your chances of success. Giving shape to all the information can be a little difficult; so, you can explore the different types of popular infographics and find inspiration for your write up. The following are the most popular content types for infographics
1) The 'How to' or 'Tips' Infographic: Follows a process driven approach, gives information on 'how this works' to the reader. The content for this type of infographic targets a specific audience, and it usually doesn't go stale over time. Examples:
- Fear of Flying: Overcoming Limitations
- How to Survive in your Home During an Emergency
- The Insider's Guide to Getting a Job at Apple
2) The 'Facts You Don't Know' Infographic: Presents new or lesser-known facts in an interesting light. May also combine well-known facts and present them in a novel way. Examples:
- 28 Odd Facts About the Human Body
- 9 Lesser-Known Facts About Obama
- What You Didn't Know About Kim Jong-II
3) The Funny Infographic: Uses observational humor to highlight a fact that is already known or suspected. The key to the success of this type of infographic depends heavily on how well the content works in tandem with images to generate hilarity. Examples:
4) The News / Current Trends Infographic: Uses currents events or news items to create items of general interest. These can include biographies or facts related to the recently deceased, product releases, upcoming trends, festivals, wars, etc. Examples:
5) The Comparison Infographic: Compares two or more separate things, usually through Venn diagrams, graphs or charts. Mostly used for comparison, and for highlighting the benefits of one's product over those of others.
- iPhone 5 vs. iPhone 4S vs. Samsung Galaxy S3
- Comparing the Veneno, LaFerrari and P1 supercars
- Workers’ Compensation: State-by-State Comparison
Once you have managed to write satisfactory and clear content, it is time to enter the designing phase.
4. Designing the Infographic
If you have a clear concept and a write up that can serve as a foundation for the visuals, you will be free to focus on the design. The first step for the designer (or you, if you are designing it on your own) is wire framing – creating a rough draft or flowchart of how the information will flow. There are several free tools that can be of help (listed below), but experience suggests it is faster to create a rough draft by pencil.
Your draft will look something like this. Before plunging into designing, show the rough draft to your colleges and ask them to find ways of making it better. Do this, because any changes made at a later stage (when the design is ready) will cost a lot of time and effort.
The next step is selecting the right format for your infographic. There are hundreds of ways in which you can represent data visually. The narrative of your story will play a part in the visual approach you follow. You can choose from the popular types of design formats used for infographics
- Flow Chart: Using boxes and connecting-arrows to explain a process or show relation between different elements.
- Typography: The words are the image. Words are arranged to create a strong visual impact.
- Periodic Table: Using the boxes in the periodic table of elements to showcase data from other niches.
- Timelines: Displaying list of events, usually in chronological order.
- Repeated Charts: Using similar charts, graphics, Venn diagrams to showcase diverse data.
- Mixed Charts: Illustrations, pie charts, and words combined to drive home the point.
- Bar Graphs: The most common infographic, using horizontal and vertical bars to show comparison.
- List Texts: Simple listing of facts in a visually appealing manner, usually text-heavy.
- Maps: Using maps of an area, country or the world to make comparisons or highlight trends.
Once you have chosen the type of format that best suits your data, it is time to create the final design. You now have everything you need: the data, a narrative with a central theme, clarity on the information flow and a solid structure for the design. Before you start designing, it would be a good idea to glance through Smashing Magazine's Dos and Don'ts of Infographic Design.
If you have a skillful designer and access to high-end software like Adobe Software, you are ready to start. But if you plan to go it alone, there are lots of awesome free tools that will help you design a decent infographic.
The real work begins after you have the designed the final version of your infographic. Now it is time to start promoting it.
5. Building Links, Sharing and Making your Infographic go Viral
While Matt Cutts hinted that Google may discount embedded infographics links in future, for now good information graphics continue to yield high-quality backlinks. Plus, the visual medium makes them immensely shareable, helping generate buzz in the social media and funnel visits to your website.
The higher the popularity of your infographic, the better it is for your brand. So how do you make it go viral? The first step is to create a well-designed, thoroughly researched and creative infographic – if your effort is not honest, no promotion can generate enough user interest.
Offer visual information that startles people, makes them laugh, makes them smile, makes their jaws drop, affects them emotionally, or provokes them to think – this way you will increase your chances of going viral. When you are confident about the relevance and quality of your work, it is time to post the infographic and launch a promotional blitz.
-
Publish the post on the site that you want to benefit (make sure you have the keywords “free” and “infographic” in the title to make it searchable). It could be your website or blog, or it could be your client's website. The next step is actively building links by submitting it to quality websites that accept infographics. Here is a list of ten reputable sites that accept infographics
- Visually
- Fuck yeah infographics
- Cool Infographics
- I Heart Infographics
- Infographr
- Submit Infographics
- Daily Infographic
- Visual Loop
- Chart Porn
- Infographic Directory
-
Look for niche blogs that deal with subject matter represented in your Infographic. For example, if you are creating an infographic about web designing, you could submit it on blogs like We Love Typography or Design Shack. If the topic is hot or original, even blogs that usually don't publish infographics may make an exception for you.
-
Include a clearly visible and easy-to-implement embed code with your infographic (this tool will do the code generation for you). Make it evident to the readers that they are free to publish your infographic on their blogs, and make it easy for them to do so.
-
Even if you provide an embed code, many people may simply copy paste the image in their blog. Include the web address of your company or product at the top and bottom part of the infographic to ensure that you get credit for your work.
-
Smart social sharing is your best shot at going viral. Include prominent social media buttons at the top and bottom of the page, encouraging the visitors to share. You can also make an appeal at the bottom of the infographic: “Did you enjoy this Infographic? If yes, please consider sharing it. Thanks!”
-
Promote the infographic on your Facebook, Twitter, Google Plus, Reddit, StumbleUpon and other social media accounts. In order to get a good response, just hint at the subject matter without being explicit and whet the curiosity of the readers. Don't forget to share it with your friends, family and other personal contacts.
-
If you have a strong base or fans, subscribers or customers who may be interested in the subject; you can send out the infographic through email (just make sure it doesn't seem spammy to the recipients).
-
If it contains information that may be interesting to a global audience, you can translate the text in the infographics and target regional blogs and infographic directories.
-
If you have created a high-end infographic, it may be a good idea to promote it through guest blogs; i.e., building a write up that hinges on all or some of the images from the infographic.
-
To get the most inbound link mileage, reformat it and create videos, PDFs and PPTs. Post these on relevant sites to extract the last bit of link juice.
Think Beyond Links, Use Infographics for Branding
There are too many people building too many infographics for online marketing. Google may give less credence to inbound infographic links in future. That may be bad news if you are building infographics simply for getting links. But you don't need to aim for links when you are marketing through this medium – social sharing can help you promote your brand directly to the customers.
The success of your Infographic depends on how well you can share it with the target audience. Relevant (and accurate) information, perfect execution, contextual placement, timely deployment and smart social media marketing will help you win the admiration of your target audience, help you popularize your brand, and help drive real, valuable traffic to your website or blog.


Comments
Please keep your comments TAGFEE by following the community etiquette
Comments are closed. Got a burning question? Head to our Q&A section to start a new conversation.